

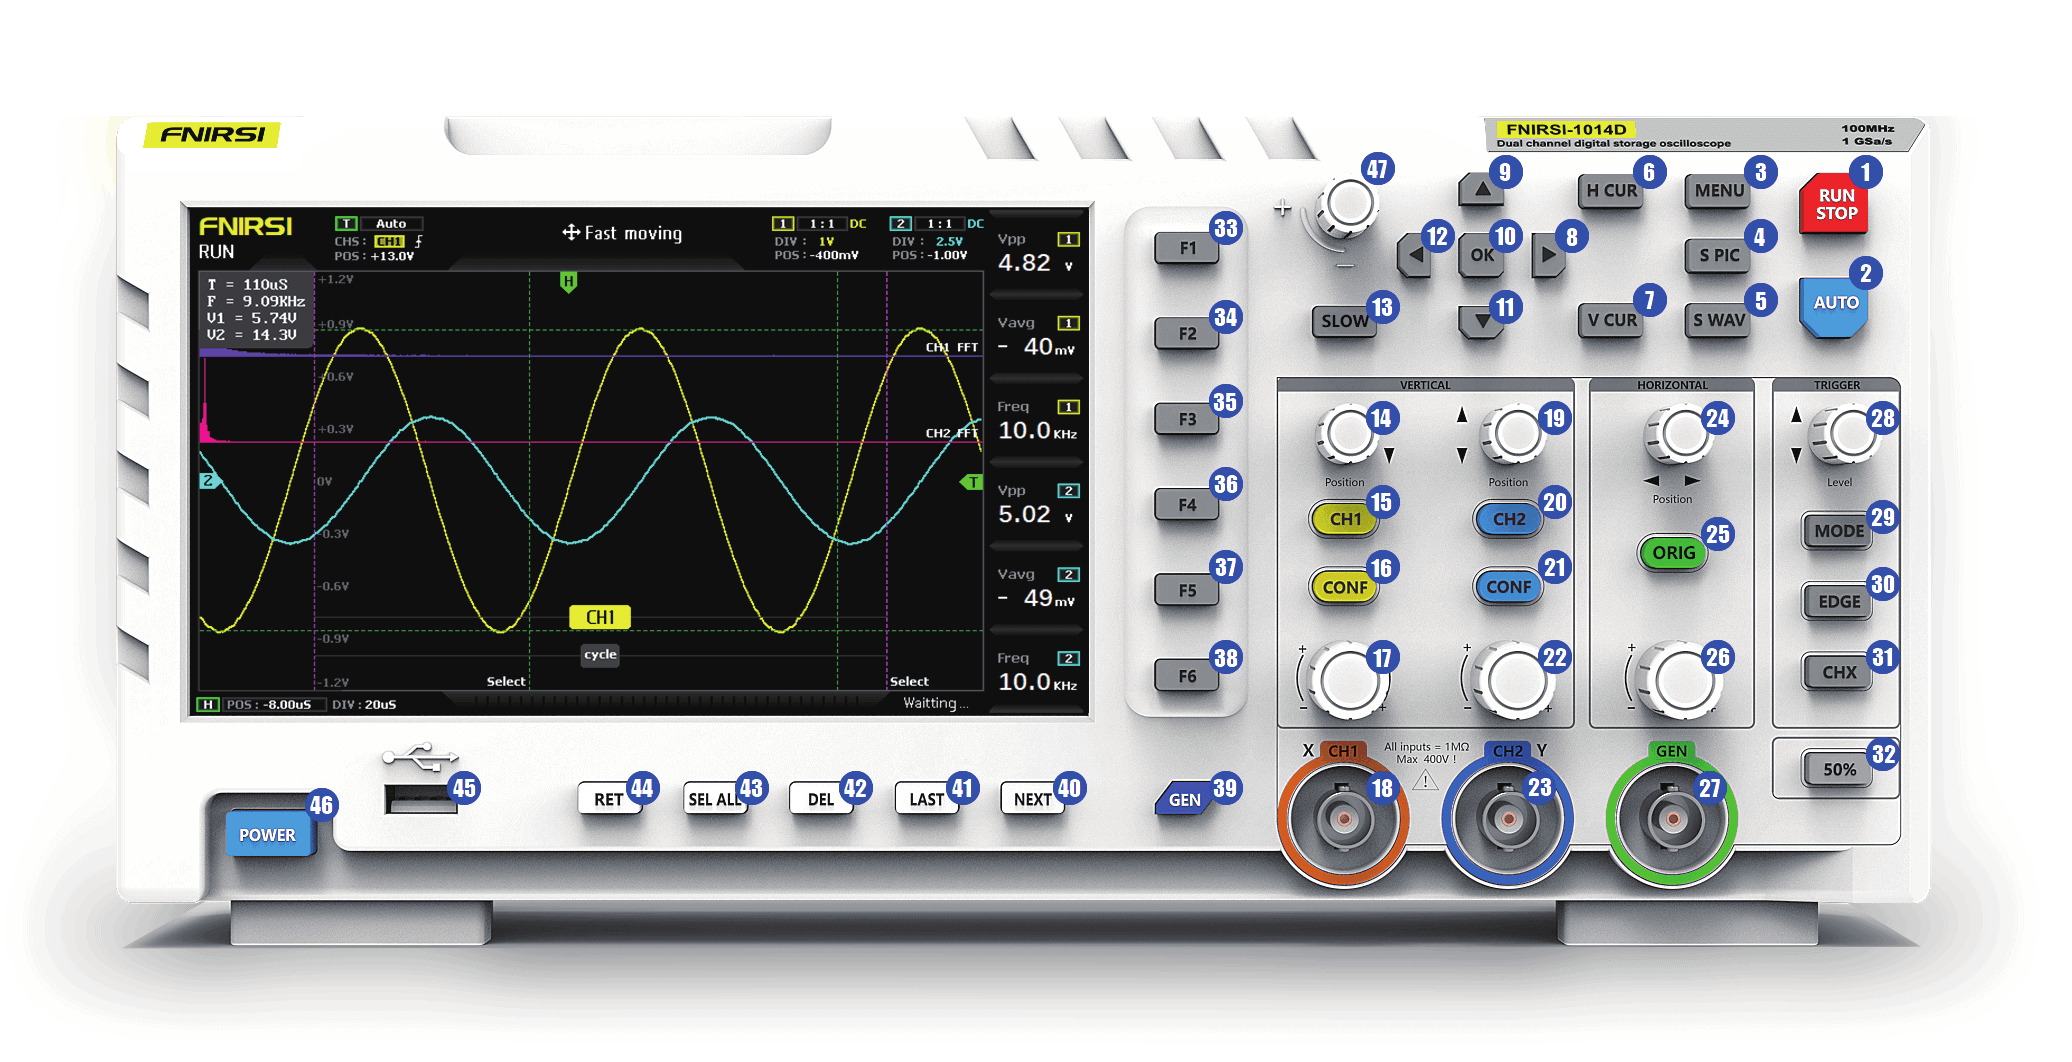
FNIRSI-1014D Oscilloscope User Manual
2-in-1 Digital Oscilloscope with Signal Generator
Product Overview
The FNIRSI-1014D is a versatile 2-in-1 device combining a dual-channel digital oscilloscope with a built-in signal generator. This cost-effective desktop instrument is designed for both maintenance professionals and R&D engineers, offering comprehensive features and high practicality.
Key Specifications
- Sampling Rate: 1 GSa/s (1 Gigasample per second)
- Analog Bandwidth: 100 MHz × 2 channels
- Display: 7-inch LCD with 800 × 480 resolution
- Trigger Modes: Single, Normal, and Automatic
- Signal Compatibility: Both periodic analog and aperiodic digital signals
- Storage Capacity: 1 GB internal storage
- Up to 1000 screenshot images
- Up to 1000 waveform data sets
Major Features
Oscilloscope Functions:
- Complete trigger functionality for both periodic analog and aperiodic digital signals
- High-voltage protection module (tolerates up to 400V continuous voltage)
- Large time-base scrolling mode for monitoring slow signal changes
- One-button auto adjustment with adaptive 25%, 50%, and 75% triggering
- Cursor measurement for direct amplitude and frequency readings
- Lissajous pattern display for comparing amplitude, frequency, and phase
- FFT (Fast Fourier Transform) viewing for harmonic component analysis
Signal Generator Features:
- Built-in DDS (Direct Digital Synthesis) function generator
- Industry-original “chopping output” feature at 2.5 Vpp
- 14 standard waveform types plus customizable waveforms
- 1 Hz frequency step precision
- Stores up to 1000 custom chopped signals
- Captures oscilloscope measurements and outputs them as generator signals
Data Management:
- Quick screenshot and waveform storage (one-click operation)
- Powerful waveform image manager with thumbnail browsing
- Functions include viewing, page navigation, deletion, zoom, and pan
- USB interface for computer connectivity and file sharing
Order your 1014D today – 2-day UK delivery, 60-day easy returns
Check the review for 1014D
⚠️ CRITICAL SAFETY WARNINGS
1. Ground Connection Requirements
When using both channels simultaneously, BOTH probe ground clips MUST be connected together.
NEVER connect ground clips to different potential points, especially on high-power equipment or different terminals of 220V circuits. Doing so will short-circuit the internal ground wires and DESTROY the oscilloscope motherboard. This applies to all oscilloscopes because both channels share a common ground.
2. Maximum Voltage Input
The BNC input can withstand a maximum of 400V. Never input more than 400V when using a 1× probe.
3. Power Supply Requirements
Use ONLY the original power supply. Never use power supplies or USB connections from devices under test, as this may cause ground wire short circuits during testing.
4. High-Frequency and High-Voltage Measurements
For high-frequency and high-voltage signals, you MUST use:
- 100× probes for ultrasonic equipment (welding machines, cleaning machines)
- 1000× probes for very high voltage applications (high-frequency transformer high-voltage terminals, induction cooker coils)
5. Probe Bandwidth Limitations
- 1× probe bandwidth: 5 MHz
- 10× probe bandwidth: 100 MHz
When measuring frequencies above 5 MHz:
- Move the switch on the probe handle to 10×
- Set the oscilloscope to 10× mode
Why this is necessary: Oscilloscope probe cables have a capacitance of 100-300 pF, which significantly attenuates high-frequency signals. At 1× setting, the effective bandwidth is only 5 MHz. The 10× attenuation provides impedance matching with the probe cable capacitance, enabling the full 100 MHz bandwidth. Use only probes rated for 100 MHz or higher.
Interface and Controls
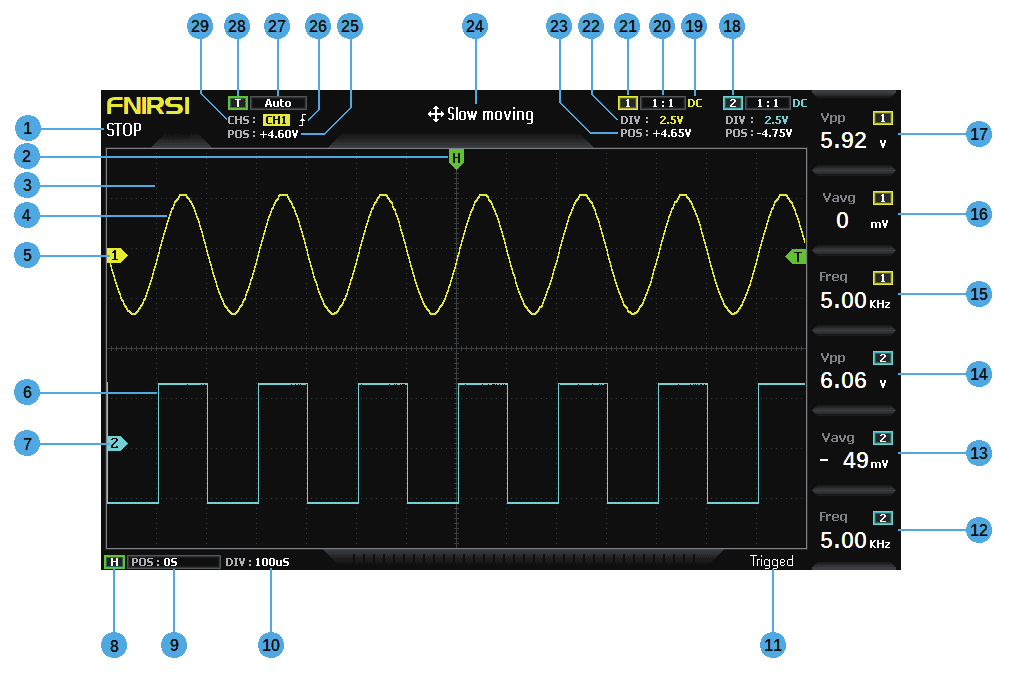
Screen Display Elements
- Run/Pause Indicator – Shows current operating state
- Trigger X Position Arrow – Indicates the trigger point location
- Background Grid – Reference tick marks
- Channel 1 Waveform – Yellow waveform data
- Channel 1 Baseline Arrow – Indicates 0V reference position
- Channel 2 Waveform – Cyan waveform data
- Channel 2 Baseline Arrow – Indicates 0V reference position
- Horizontal Time Base Control Bar
- Trigger X Position – Relative to system coordinates
- Horizontal Time Base – Time duration per grid division
- Trigger Status Flag 12-17. Measurement Parameters – Six columns (F1-F6) showing selected measurements
- Channel 2 Control Bar Sign
- Channel 1 Input Coupling Mode – DC or AC
- Channel 1 Probe Magnification
- Channel 1 Control Bar Sign
- Channel 1 Vertical Sensitivity – Voltage per grid
- Channel 1 Baseline Position
- Movement Speed – Fast or Slow
- Trigger Voltage Arrow Position
- Trigger Edge Indicator – ↑ rising or ↓ falling edge
- Trigger Mode Indicator – Auto, Single, or Normal
- Trigger Control Bar Flag
- Trigger Channel – CH1 or CH2
Control Panel Reference
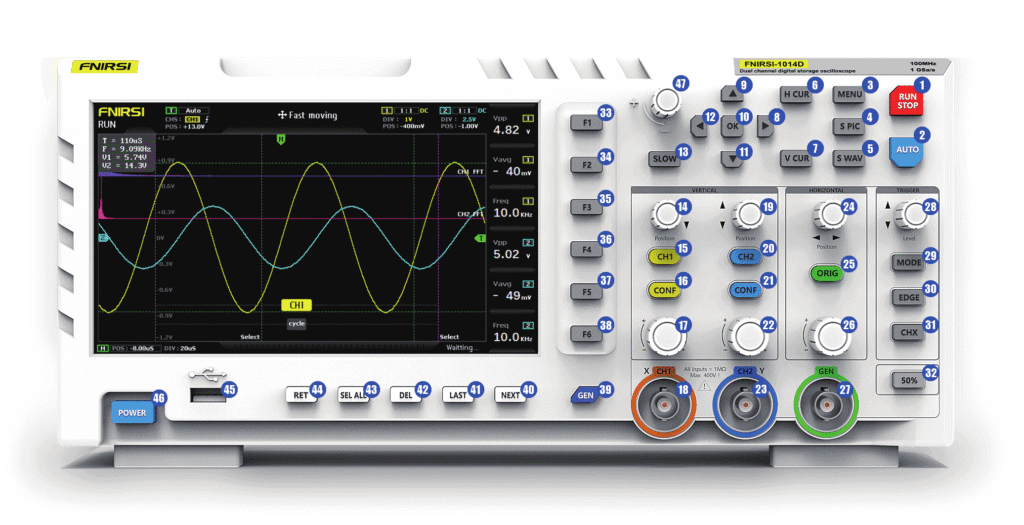
Front Panel Buttons
Top Row:
- Run/Stop – Pause or resume sampling
- Auto – One-button automatic waveform adjustment
- Menu – Access function menu
- S Pic – Capture full-screen screenshot
- S Wav – Save current waveform data
- H Cur – Toggle time cursor on/off
- V Cur – Toggle voltage cursor on/off
Navigation Controls: 8. ↑ Up – System navigation key 9. → Right – System navigation key 10. OK – Confirm selection 11. ↓ Down – System navigation key 12. ← Left – System navigation key 13. Slow – Toggle between fast and slow movement
Channel 1 Controls (Left Side): 14. Vertical Position Knob – Move waveform up/down 15. CH1 Switch – Turn Channel 1 display on/off 16. CONF – Channel 1 configuration menu 17. Vertical Sensitivity Knob – Adjust voltage scale 18. Input Port – BNC connector (0-40V measurement range, 400V maximum tolerance)
Channel 2 Controls (Right Side): 19. Vertical Position Knob – Move waveform up/down 20. CH2 Switch – Turn Channel 2 display on/off 21. CONF – Channel 2 configuration menu 22. Vertical Sensitivity Knob – Adjust voltage scale 23. Input Port – BNC connector (0-40V measurement range, 400V maximum tolerance)
Horizontal and Trigger Controls: 24. Trigger X Position Knob – Move trigger point left/right 25. Center Button – Return all positions to center 26. Time Base Knob – Adjust horizontal time scale 27. Gen Output – DDS signal generator output port 28. Trigger Y Position Knob – Adjust trigger voltage level 29. Mode – Switch trigger mode (Auto/Single/Normal) 30. Edge – Switch trigger edge (Rising/Falling) 31. CH – Select trigger channel (CH1/CH2) 32. 50% – Automatic 50% trigger level
Measurement Parameter Buttons: 33-38. F1-F6 – Select measurement parameters for each column
Signal Generator and File Management: 39. Gen – Signal generator control menu 40. Next – Navigate to next page in file manager 41. Previous – Navigate to previous page in file manager 42. Delete – Remove selected files 43. Select All – Select all files 44. Return – Exit file manager
Rear Panel: 45. USB Port – For file sharing with computer 46. Power Switch – Turn device on/off
Oscilloscope Operation Guide
Channel Management
Turn Channel On/Off:
- Click [CH1] or [CH2] to toggle the respective channel display
Enable/Disable FFT:
- Click [CONF] under CH1 or CH2
- Use navigation keys to toggle FFT on/off
Set Input Coupling Mode:
- Click [CONF] under CH1 or CH2
- Use navigation keys to switch between DC and AC coupling
Set Probe Input Ratio:
- Click [CONF] under CH1 or CH2
- Use navigation keys to select 1×, 10×, or 100×
Waveform Adjustment
Scaling Waveforms:
- Vertical (Channel 1): Rotate large knob at bottom-left corner
- Vertical (Channel 2): Rotate large knob at bottom-right corner
- Horizontal (Both Channels): Rotate large knob at bottom center
- Clockwise = Enlarge
- Counter-clockwise = Reduce
Moving Waveforms:
- Vertical (Channel 1): Rotate small knob at upper-left corner
- Vertical (Channel 2): Rotate small knob at upper-right corner
- Horizontal (Both Channels): Rotate small knob at upper center
- Clockwise = Move right/up
- Counter-clockwise = Move left/down
- Click [Slow] button to toggle between coarse and fine adjustment
Adjust Trigger Voltage:
- Rotate the small knob under the trigger section
- Click [Slow] to select coarse or fine adjustment
- Note: First disable “Automatic 50%” in the menu, or trigger voltage cannot be manually adjusted
Trigger Settings
Set Trigger Edge:
- Click [Edge] to switch between Rising (↑) and Falling (↓) edge
Set Trigger Mode:
- Click [Mode] to cycle through:
- Auto – Automatic continuous triggering
- Single – Single-shot trigger (captures once)
- Normal – Normal trigger (waits for trigger condition)
Automatic Trigger Adjustment:
- Click [50%] button for automatic 25%/50%/75% trigger level based on signal characteristics
Display Control
Pause/Resume Display:
- Click the red [Run/Stop] button
Automatic Waveform Adjustment:
- Click the blue [Auto] button for automatic optimization
Slow Scan Scrolling Mode:
- Rotate the horizontal time base knob counter-clockwise
- When time base reaches 100 ms or higher, the system enters slow scan mode
- Range: 100 ms to 50 seconds
Cursor Measurements
Time Cursor:
- Click [H Cur] to enable time cursor
- Use ← and → navigation keys to select left or right cursor line (highlighted cursor will brighten)
- Rotate the small knob at upper-left corner to move the selected cursor
- Clockwise = Move right
- Counter-clockwise = Move left
Voltage Cursor:
- Click [V Cur] to enable voltage cursor
- Use ↑ and ↓ navigation keys to select upper or lower cursor line
- Rotate the small knob at upper-left corner to move the selected cursor
- Clockwise = Move up
- Counter-clockwise = Move down
Parameter Display
Select Measurement Parameters:
- Click F1 through F6 for each column
- Use navigation keys or nearby knob to select desired parameter
- Available measurements include: frequency, period, duty cycle, peak-to-peak voltage, RMS voltage, average voltage, etc.
Data Capture and Storage
Full-Screen Capture:
- Click [S Pic] to save current display as BMP image file
Save Waveform Data:
- Click [S Wav] to save all active channel waveform data
View Saved Screenshots:
- Click [Menu] button
- Navigate to [Picture Browse]
- Press [OK] to enter thumbnail preview
- Use navigation keys to select thumbnail
- Press [OK] to view full-screen
- Use controls: RET (Return), SEL (Select All), DEL (Delete), Last, Next
View Saved Waveforms:
- Click [Menu] button
- Navigate to [Waveform Browse]
- Press [OK] to enter thumbnail preview
- Select and view using same controls as screenshots
- Can zoom, pan, and analyze saved waveforms
Delete Saved Data:
- In browse mode, select item and click [DEL] button
- Or delete from full-screen view
Connect to Computer:
- Click [Menu] button
- Navigate to [USB Share]
- Press [OK] to enable USB mode
- Connect USB cable to computer
- Computer will show removable disk/USB drive
- Important: Do not rename files on the disk, or the oscilloscope will not be able to display them in the picture manager
System Settings
Adjust Screen Brightness:
- Click [Menu] button
- Navigate to [Screen Brightness]
- Press [OK]
- Adjust using small knob (0 = darkest, 100 = brightest)
Adjust Grid Brightness:
- Click [Menu] button
- Navigate to [Grid Brightness]
- Press [OK]
- Adjust using small knob (0 = grid off, 100 = brightest)
Enable Automatic 50% Trigger:
- Click [Menu] button
- Navigate to [Automatic 50%]
- Press [OK]
- Select [ON] using navigation keys
- When enabled, system automatically sets trigger voltage to 25%/50%/75% of peak-to-peak value based on waveform characteristics
Baseline Calibration: Perform this when the baseline arrow and actual waveform baseline don’t align (with probe disconnected):
- Disconnect probe
- Click [Menu] button
- Navigate to [Baseline Calibration]
- Press [OK] to calibrate
Signal Generator Operation Guide
Basic Waveform Generation
Switch Waveform Type:
- Click [Gen] button
- Signal generator control interface appears in lower-right corner
- Press [OK] to move selection box to [Waveform Type]
- Use ↑/↓ navigation keys or upper-left knob to cycle through waveform types
- Available types: Sine, Square, Triangle, Sawtooth, Pulse, Noise, DC, and more
Adjust Frequency:
- Click [Gen] button
- Press [OK] to move selection box to [Frequency]
- Use ←/→ navigation keys to position cursor at desired digit
- Use ↑/↓ or upper-left knob to increase/decrease the selected digit
- Frequency step: 1 Hz precision
Adjust Square Wave Duty Cycle: (Only applicable to square wave type)
- Click [Gen] button
- Press [OK] to move selection box to [Duty Cycle]
- Rotate upper-left knob to adjust from 1% to 99%
Advanced Feature: Waveform Capture
The “Capture Waveform” feature allows you to capture part or all of a displayed waveform and use it as a signal generator output. Up to 1000 custom captured signals can be stored.
Capture a Waveform:
- Display the waveform you want to capture on screen
- Click [Menu] button
- Navigate to [Capture Output]
- Press [OK] to open capture mode
- Two purple boundary lines appear on screen
Adjust Capture Boundaries:
- The word “SELECT” indicates which boundary line is currently active
- Use ←/→ navigation keys to switch between left and right boundaries
- Rotate upper-left knob to move the selected boundary
- Click [Slow] to toggle between coarse and fine adjustment
- The captured segment is between the two purple lines
Select Capture Channel:
- Text between boundaries shows “Channel 1” or “Channel 2”
- Use ↑/↓ navigation keys to switch channels
Optimize Capture Quality:
- Adjust Voltage Level: Move the channel Y-position to set the DC offset of the captured signal
- Example: Position waveform at +1V for +1V DC output, at -1V for -1V DC output
- Adjust Amplitude: Use vertical sensitivity to scale the waveform
- Recommendation: Maximize signal amplitude without clipping the top or bottom
- Larger captured signals have more sample data, resulting in lower distortion and higher resolution
- Small captured signals enlarged later will show severe staircase effects due to insufficient sampling
Save Captured Signal:
- After setting all parameters, press [OK] to save the capture to system memory
Output Captured Waveform:
- Click [Gen] button
- Press [OK] to move selection to [Waveform Type]
- Use ↑/↓ to select “Self Definition” (Custom)
- Exit generator menu
- Click [Menu] button
- Navigate to [Output Browsing]
- Press [OK] to view all saved captured signals
- Use navigation keys to select desired signal
- Press [OK] – yellow “OUTPUT” text appears on the waveform
- Click [Menu] to exit
- The signal generator now outputs the selected captured waveform
Important Notes on Captured Waveform Frequency:
- If captured waveform contains one complete cycle, output frequency equals the set frequency
- If captured waveform contains N complete cycles, output frequency = N × set frequency
- Trigger adjustment is critical: Set trigger voltage to the minimum edge of the waveform to ensure accurate frequency calculation
- Incorrect trigger positioning may cause displayed frequency to be several times the actual frequency
Troubleshooting Guide
Q1: Device won’t turn on after receiving it?
Solution:
- Verify power cord is properly connected to oscilloscope
- Check that wall socket has power
- Try a different power adapter (such as a mobile phone charger)
- If still not working, contact customer service for replacement
Q2: No waveform displayed, only a stationary line on screen?
Solution:
- Check if [Run/Stop] is paused – if so, press it to resume
- Press [Auto] button once
- If still no waveform:
- Verify signal source is actually outputting a signal
- Check probe for short circuit or open circuit using a multimeter
- Test probe and signal source independently
Q3: Voltage measurement shows 0?
Solution:
- Adjust vertical sensitivity and time base
- Or press [Auto] button
- Display should show at least one clear, complete waveform cycle
- Top and bottom of waveform must be visible (not clipped)
- Voltage reading will be accurate once waveform is properly displayed
Q4: Frequency measurement shows 0?
Solution:
- Ensure trigger mode is set to Auto (automatic triggering)
- Press [Auto] button once
- Display should show at least one clear, complete waveform cycle
- Waveform must be triggered (green arrow position fixed, not shaking)
- Frequency reading will be accurate once waveform is properly triggered
Q5: Duty cycle shows 0?
Solution:
- Ensure trigger mode is set to Auto
- Adjust trigger line to intersect the waveform
- When waveform is properly triggered (fixed position), the duty cycle reading will be correct
- At least one complete waveform cycle must be visible
Q6: AC coupling looks the same as DC coupling?
Explanation:
- For symmetrical AC signals (such as 220V household power), AC and DC coupling appear identical
- For asymmetrical AC signals or DC pulse signals, the waveform will shift vertically when switching coupling modes
Q7: Waveform moves up and down continuously, appears as multiple overlapping lines?
Solution:
- Set trigger mode to Auto
- Press [Auto] button
- If not resolved:
- Probe ground clip may not be connected or may have open circuit
- Check probe with multimeter
Q8: Waveform shakes horizontally and won’t stabilize?
Solution:
- Adjust trigger voltage (green arrow on right side)
- Position trigger level at the top or bottom edge of the waveform
- Or enable “Automatic 50%” in the menu settings
Q9: Cannot capture sudden pulses or digital logic signals?
Solution:
- Change trigger mode to “Normal” or “Single”
- Adjust trigger voltage, time base, and vertical sensitivity
- Wait for signal to appear, then press [Run/Stop] to pause
Q10: Trigger voltage adjustment has no effect?
Solution:
- Click [Menu] → Navigate to [Auto 50%] → Turn it OFF
Q11: Measuring a battery shows no waveform?
Explanation:
- Battery voltage is a stable DC signal with no curve
- In DC coupling mode, adjust vertical sensitivity to see an upward or downward offset straight line
- In AC coupling mode, DC signals are blocked and no waveform will appear
Q12: Why does 220V 50Hz measurement cause display to lag?
Explanation:
- To display 50 Hz low-frequency signals, the oscilloscope must use a very low sampling rate
- This causes the display to update slowly, appearing as “lag”
- This is normal behavior for ALL oscilloscopes when measuring 50Hz signals – it’s not a defect
Q13: Measuring household 220V shows peak-to-peak voltage over 600V, not 220V or 310V?
Explanation:
- 220V is the RMS (effective) value, not peak-to-peak
- Household 220V AC is symmetrical:
- Positive peak: +310V
- Negative peak: -310V
- Peak-to-peak (Vpp) = 620V
- Switch measurement parameter to “RMS” or “Effective Value” to see the familiar 220V
- Actual household voltage fluctuates between 180-260V RMS (507-733V peak-to-peak)
Q14: Measured 220V is not a perfect sine wave – shows distortion?
Explanation:
- Municipal power grids typically contain harmonic pollution
- Higher-order harmonics superimpose on the fundamental sine wave, causing distortion
- This is normal and reflects actual power quality – it’s not an oscilloscope problem
Q15: Baseline (0V) and left arrow don’t align when no signal is connected?
Solution:
- Disconnect probe
- Click [Menu]
- Navigate to [Baseline Calibration]
- Press [OK]
- Wait for calibration to complete – baseline and arrow will align
Q16: Signals above 5MHz show significant attenuation – bandwidth seems limited to 5MHz?
Solution:
- When measuring 5 MHz or higher frequencies:
- Move probe switch to 10× position
- Set oscilloscope to 10× input mode
- Why: Probe cable has 100-300 pF capacitance, which severely attenuates high-frequency signals
- At 1× setting, effective bandwidth is only 5 MHz
- 10× setting provides impedance matching, enabling full 100 MHz bandwidth
- Only use probes rated for 100 MHz or higher
Common Test Scenarios
1. Battery or DC Voltage Measurement
Probe Setting:
- Battery voltage typically below 40V: Use 1×
- DC voltage above 40V: Use 10× (both probe and oscilloscope)
Procedure:
- Set oscilloscope to Auto trigger mode (default at startup)
- Set probe multiplier to 1× (or appropriate setting)
- Set coupling mode to DC
- Insert probe and move switch to corresponding position
- Ensure battery/DC source is powered
- Connect probe clip to negative terminal, probe tip to positive terminal
- Press [Auto] once
- Read the “Average” parameter for DC voltage value
Note: DC signals appear as a horizontal line with slight offset, not a curve. Peak value and frequency will read 0.
2. Crystal Oscillator Measurement
Probe Setting: 10× (both probe and oscilloscope)
Reason: Crystals easily stop oscillating when encountering capacitance. 1× probe has 100-300 pF input capacitance, while 10× has only 10-30 pF.
Procedure:
- Set oscilloscope to Auto trigger mode
- Set probe multiplier to 10×
- Set coupling mode to AC
- Move probe switch to 10×
- Ensure crystal board is powered and running
- Connect probe clip to ground (power supply negative)
- Remove probe cap to expose needle tip
- Touch needle tip to one crystal oscillator pin
- Press [Auto] to display crystal waveform
- Manually adjust if waveform is too small or large
3. PWM Signal (MOS/IGBT Drive) Measurement
Probe Setting: 1× (both probe and oscilloscope)
Reason: PWM drive signals typically 3-20V, well within 40V maximum of 1× range
Procedure:
- Set oscilloscope to Auto trigger mode
- Set probe multiplier to 1×
- Set coupling mode to DC
- Move probe switch to 1×
- Ensure PWM board has active signal output
- Connect probe clip to MOS/IGBT Source (S) pin
- Connect probe tip to Gate (G) pin
- Press [Auto] to display PWM waveform
- Manually adjust if needed
4. Signal Generator Output Measurement
Probe Setting: 1× (both probe and oscilloscope)
Reason: Signal generator output typically within 30V
Procedure:
- Set oscilloscope to Auto trigger mode
- Set probe multiplier to 1×
- Set coupling mode to DC
- Move probe switch to 1×
- Ensure signal generator is on and outputting
- Connect probe clip to generator black (ground) lead
- Connect probe tip to generator red (signal) lead
- Press [Auto] to display generated waveform
5. Household AC Power (220V/110V) Measurement
Probe Setting: 100× (requires separate 100× probe – not included)
Reason:
- Household power: 180-260V RMS = 507-733V peak-to-peak
- 1× maximum: 40V
- 10× maximum: 400V (included probe)
- 100× maximum: 4000V (required for safe measurement)
Procedure:
- Purchase 100× probe separately
- Set oscilloscope to Auto trigger mode
- Set probe multiplier to 100×
- Set coupling mode to AC
- Move probe switch to 100×
- Ensure AC power outlet is active
- Connect probe clip and tip to both AC wires (polarity doesn’t matter)
- Press [Auto] to display AC waveform
⚠️ WARNING: Standard 10× probe CANNOT safely measure household AC power!
6. Power Supply Ripple Measurement
Probe Setting:
- Output below 40V: 1×
- Output 40-400V: 10×
Procedure:
- Set oscilloscope to Auto trigger mode
- Set probe multiplier to appropriate gear
- Set coupling mode to AC (critical for ripple measurement)
- Move probe switch to corresponding position
- Ensure power supply is on and outputting voltage
- Connect probe clip to power supply negative output
- Connect probe tip to power supply positive output
- Wait ~3 seconds for baseline to stabilize (yellow line and arrow align)
- Press [Auto] to display ripple waveform
Note: AC coupling is essential – it blocks DC component and shows only AC ripple.
7. Inverter Output Measurement
Probe Setting: 100× (requires separate purchase)
Reason: Inverter output similar to household AC power, peak-to-peak above 500V
Procedure:
- Set oscilloscope to Auto trigger mode
- Set probe multiplier to 100×
- Set coupling mode to DC
- Move probe switch to 100×
- Ensure inverter is powered and outputting
- Connect probe clip and tip to inverter output (polarity doesn’t matter)
- Press [Auto] to display inverter waveform
8. Audio/Power Amplifier Signal Measurement
Probe Setting: 1× (both probe and oscilloscope)
Reason: Amplifier output typically below 40V
Procedure:
- Set oscilloscope to Auto trigger mode
- Set probe multiplier to 1×
- Set coupling mode to AC
- Move probe switch to 1×
- Ensure amplifier is on and outputting audio
- Connect probe clip and tip to amplifier output terminals (polarity doesn’t matter)
- Press [Auto] to display audio waveform
9. Vehicle Communication/Bus Signal Measurement
Probe Setting: 1× (both probe and oscilloscope)
Reason: Automotive communication signals typically below 20V
Procedure:
- Set oscilloscope to Normal trigger mode (not Auto)
Reason: Communication signals are non-periodic digital signals - Set probe multiplier to 1×
- Set coupling mode to AC
- Move probe switch to 1×
- Connect probe clip and tip to two communication signal lines (polarity doesn’t matter)
If multiple signal lines exist, identify correct pair first - Ensure communication is actively occurring
- Adjust vertical sensitivity to 50 mV
- Adjust time base to 20 μs
- Press [50%] once
- When communication occurs, oscilloscope will capture and display signal
- If no capture, try adjusting:
- Time base (1 ms to 100 ns range)
- Trigger voltage (green arrow position)
10. Infrared Remote Control Receiver Measurement
Probe Setting: 1× (both probe and oscilloscope)
Reason: IR signals typically 3-5V
Procedure:
- Set oscilloscope to Normal trigger mode
Reason: IR remote signals are non-periodic digital coded signals - Set probe multiplier to 1×
- Set coupling mode to DC
- Move probe switch to 1×
- Connect probe clip to IR receiver ground (negative)
- Connect probe tip to IR receiver data pin
- Adjust vertical sensitivity to 500 mV
- Adjust time base to 20 μs
- Rotate trigger arrow (red) to approximately 1 grid distance from left yellow arrow
- Press button on IR remote control
- Waveform will appear on oscilloscope
11. Sensor Amplifier Circuit Measurement
(Temperature, Humidity, Pressure, Hall Effect, etc.)
Probe Setting: 1× (both probe and oscilloscope)
Important: Sensor raw signals are very weak (millivolts) and cannot be measured directly. You must locate the amplifier output on the sensor board.
Procedure:
- Set oscilloscope to Auto trigger mode
- Set probe multiplier to 1×
- Set coupling mode to DC
- Move probe switch to 1×
- Connect probe clip to sensor board ground (power supply negative)
- Locate amplifier output pin and connect probe tip
- Adjust vertical sensitivity to 50 mV
- Adjust time base to 500 ms (enters slow scan mode)
- Move baseline to bottom of screen
- If signal line appears at top, reduce vertical sensitivity
(Try 100 mV, 200 mV, 500 mV progressively) - Optimal display: signal traces in middle of screen (not clipped at top)
- Observe slow changes as sensor responds to stimulus
Specifications Summary
| Feature | Specification |
|---|---|
| Channels | 2 (independent) |
| Bandwidth | 100 MHz per channel |
| Sampling Rate | 1 GSa/s |
| Input Voltage Range | 0-40V (1× mode) |
| Maximum Input | 400V continuous (with protection) |
| Display | 7″ LCD, 800 × 480 resolution |
| Time Base Range | 2 ns/div to 50 s/div |
| Trigger Modes | Auto, Normal, Single |
| Trigger Types | Edge (Rising/Falling) |
| Coupling | AC, DC |
| Storage | 1 GB (1000 screenshots + 1000 waveforms) |
| Signal Generator | Built-in DDS, 14 waveforms + custom |
| Generator Output | 2.5 Vpp |
| Frequency Step | 1 Hz precision |
| Interface | USB (file sharing) |
| Power | DC adapter (included) |
Maintenance and Care
- Always use the original power adapter
- Never exceed 400V input voltage
- Store in cool, dry environment (avoid moisture and extreme temperatures)
- Clean screen with soft, lint-free cloth only (no solvents)
- Protect probes from physical damage – coiled cables and broken connectors affect measurements
- Perform baseline calibration periodically if baseline and arrow misalign
- Safely eject USB drive from computer before disconnecting cable
Warranty and Support
For technical support, warranty information, or product inquiries, please contact FNIRSI customer service.


