FNIRSI-1013D Oscilloscope User Manual
Product Overview
The FNIRSI-1013D is a full-featured, highly practical, and cost-effective dual-channel touchscreen oscilloscope designed for maintenance professionals and R&D engineers. This portable instrument combines professional performance with intuitive touchscreen operation for maximum convenience.
Key Specifications
- Sampling Rate: 1 GSa/s (1 Gigasample per second)
- Analog Bandwidth: 100 MHz × 2 channels
- Display: 7-inch capacitive touchscreen with 800 × 480 resolution
- Operation Method: Touch + gesture control
- Trigger Modes: Single, Normal, and Automatic
- Signal Compatibility: Both periodic analog and aperiodic digital signals
- Storage Capacity: 1 GB internal storage
- Up to 1000 screenshot images
- Up to 1000 waveform data sets
- Battery: Built-in 6000mAh rechargeable lithium battery
- Battery Life: Up to 4 hours on full charge
- Charging: Can be used while charging (like a laptop)
Major Features
Oscilloscope Functions:
- Complete trigger functionality for both periodic analog and aperiodic digital signals
- High-voltage protection module (tolerates up to 400V continuous voltage)
- Large time-base scrolling mode for monitoring slow signal changes
- One-button AUTO function for instant waveform optimization
- Intuitive capacitive touchscreen with gesture operation
- Cursor measurement for direct amplitude and frequency readings
- Lissajous pattern display for comparing amplitude, frequency, and phase
- FFT (Fast Fourier Transform) viewing for harmonic component analysis
Touchscreen Interface:
- Intuitive touch and swipe gestures
- No complex menu navigation required
- Direct waveform manipulation with fingers
- Pinch to zoom, swipe to scroll
- Single-tap controls for all functions
Data Management:
- Quick screenshot and waveform storage (one-touch operation)
- Powerful waveform picture manager with thumbnail browsing
- Functions include viewing, page navigation, deletion, zoom, and pan
- USB interface for computer connectivity and file sharing
Portable Design:
- Built-in rechargeable 6000mAh battery
- 4-hour continuous operation on full charge
- Use while charging capability
- Lightweight and compact for field work
Order your 1013D today – 2-day UK delivery, 60-day easy returns
Probe Bandwidth Limitations
- 1× probe bandwidth: 5 MHz
- 10× probe bandwidth: 100 MHz
When measuring frequencies above 5 MHz:
- Move the switch on the probe handle to 10×
- Set the oscilloscope to 10× mode
Why this is necessary: Oscilloscope probe cables have a capacitance of 100-300 pF, which significantly attenuates high-frequency signals. At 1× setting, the effective bandwidth is only 5 MHz. The 10× attenuation provides impedance matching with the probe cable capacitance, enabling the full 100 MHz bandwidth. Use only probes rated for 100 MHz or higher.
Screen Interface and Touch Controls
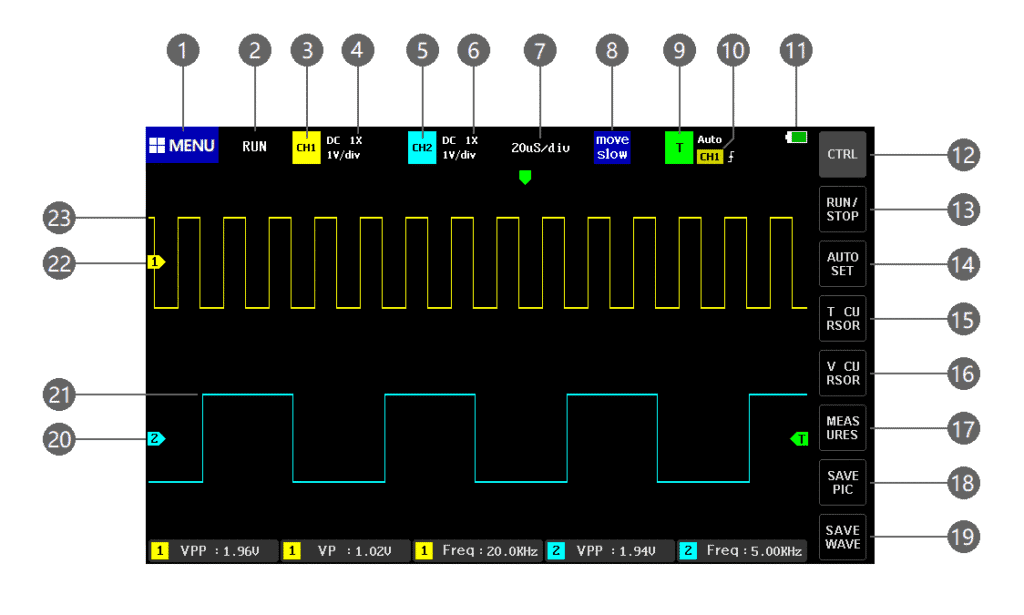
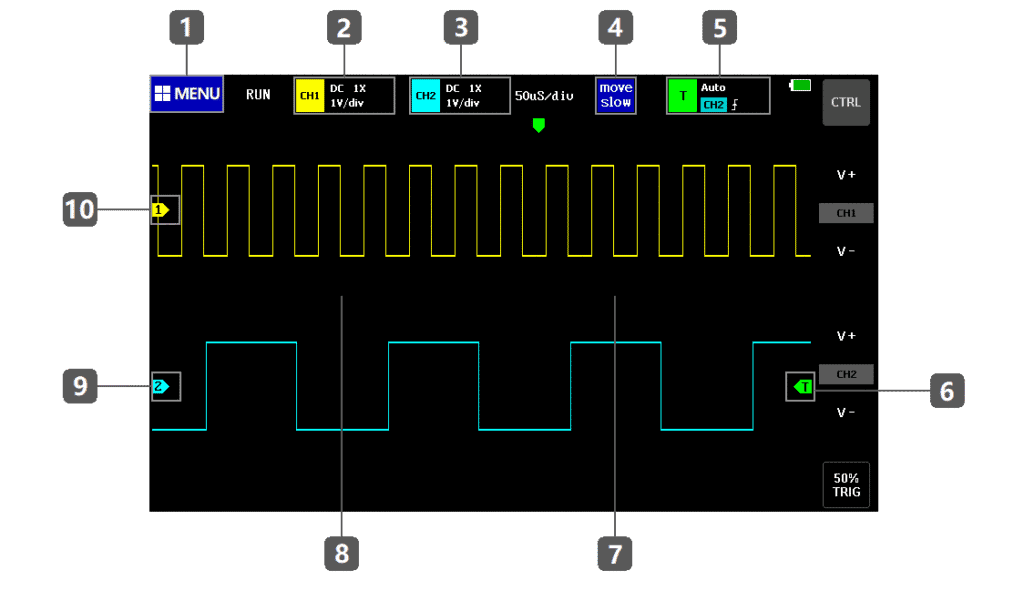
Display Elements
- Menu Button Icon – Opens function menu with system settings, saved screenshots, waveforms, and USB mode
- Run/Pause Indicator – Shows current operating state
- Channel 1 Position Area – All parameters in this area relate to Channel 1; tap to open CH1 control bar
- Channel 1 Probe Magnification – 1×, 10×, or 100× settings
- Channel 2 Position Area – All parameters in this area relate to Channel 2; tap to open CH2 control bar
- Channel 2 Probe Magnification – 1×, 10×, or 100× settings
- System Time Base – Time duration per horizontal grid division (determined by sampling rate)
- Movement Speed – Shows [Move coarse adjustment] for fast movement or [Move fine adjustment] for slow movement
- Trigger Indication – All trigger-related parameters; tap to open trigger control bar
- Trigger Channel – CH1 or CH2 selection
- Battery Indicator – Green blocks show remaining power
- Control Bar Function Switch – Switches between 2 types of button bars
- Run/Pause Button – Tap to switch between running and paused states
- Auto Adjustment Button – Automatically identifies signal and optimizes display parameters
- Time Cursor Switch – Turns cursor measurement on/off
- Voltage Cursor Switch – Turns voltage cursor measurement on/off
- Measurement Parameter Selection – Opens parameter selection bar
- Screenshot Button – Captures entire screen and saves automatically
- Waveform Save Button – Saves all channel waveform data
- Channel 2 Baseline Arrow – Indicates 0V position
- Channel 2 Waveform Data – Cyan waveform
- Channel 1 Baseline Arrow – Indicates 0V position
- Channel 1 Waveform Data – Yellow waveform
- Channel 1 Input Coupling – DC or AC coupling indicator
- Channel 1 Vertical Sensitivity – Voltage per vertical grid division
- Channel 2 Input Coupling – DC or AC coupling indicator
- Channel 2 Vertical Sensitivity – Voltage per vertical grid division
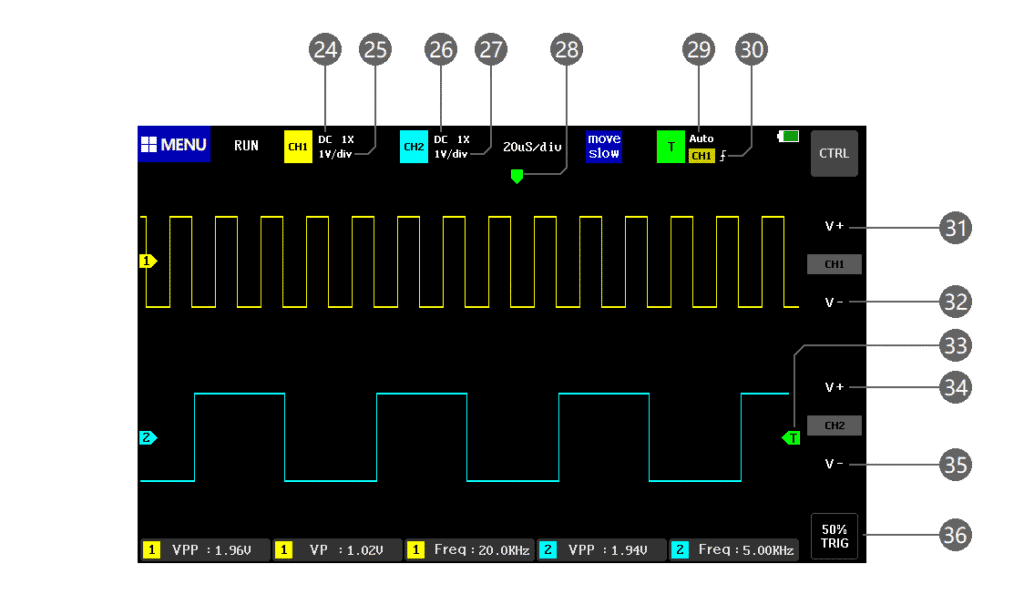
- Trigger X Position Arrow – Indicates trigger point location
- Trigger Mode Indicator – Auto, Single, or Normal trigger mode
- Trigger Edge Indicator – ↑ rising edge, ↓ falling edge
- CH1 Vertical Sensitivity Increase (+) – Zoom in vertically (stretch)
- CH1 Vertical Sensitivity Decrease (-) – Zoom out vertically (compress)
- Trigger Voltage Icon – Trigger threshold indicator
- CH2 Vertical Sensitivity Increase (+) – Zoom in vertically (stretch)
- CH2 Vertical Sensitivity Decrease (-) – Zoom out vertically (compress)
- 50% Trigger Button – Sets trigger voltage to middle of waveform amplitude
- Note: Cannot be used for PWM waveforms with dead time; set trigger arrows to waveform edges for these signals
Touch Gesture Controls
Touch Zones
- System Function Menu Area – Tap to open system function and settings menu
- Channel 1 Control Bar Area – Tap to open CH1 parameter control bar
- Channel 2 Control Bar Area – Tap to open CH2 parameter control bar
- Movement Speed Button Area – Tap to switch between fast and slow movement
- Trigger Control Bar Area – Tap to open trigger parameter control bar
- Trigger Voltage Button Area – Press and slide up/down to adjust trigger voltage
- Time Base Decrease Area (Right of grid centerline) – Zoom in horizontally (stretch waveform)
- Time Base Increase Area (Left of grid centerline) – Zoom out horizontally (compress waveform)
- Channel 2 Baseline Button Area – Press and slide up/down to adjust CH2 baseline; or tap waveform directly to move
- Channel 1 Baseline Button Area – Press and slide up/down to adjust CH1 baseline; or tap waveform directly to move
Gesture Operations
Waveform Movement:
- Tap and drag waveform – Move waveform in any direction
- Tap baseline arrows – Vertical movement of individual channels
- Swipe left/right – Horizontal waveform scrolling
Zoom Operations:
- Tap right half of display – Zoom in horizontally (reduce time base)
- Tap left half of display – Zoom out horizontally (increase time base)
- Use [V+] and [V-] buttons – Vertical zoom (after pressing [CTRL])
Trigger Adjustment:
- Tap and drag green arrow – Adjust trigger voltage level
- Quick positioning – Tap location where you want trigger line
Operation Instructions
Channel Management
Turn Channel 1 or Channel 2 On/Off:
- Tap the yellow CH1 or CH2 control bar area in upper-left corner
- Channel parameter control bar appears
- In the [Open CH1] or [Open CH2] row:
- Tap [ON] to enable the channel
- Tap [OFF] to close the channel
Turn FFT On/Off:
- Tap the yellow CH1 or CH2 control bar area
- Channel parameter control bar appears
- In the [Open FFT] row:
- Tap [ON] to enable FFT for this channel
- Tap [OFF] to close FFT
Set Input Coupling Mode:
- Tap the yellow CH1 or CH2 control bar area
- Channel parameter control bar appears
- In the [Coupling] row:
- Tap [DC] for DC coupling
- Tap [AC] for AC coupling
Set Probe Input Magnification:
- Tap the yellow CH1 or CH2 control bar area
- Channel parameter control bar appears
- In the [Probe Mode] row:
- Tap [1×] for 1× input magnification
- Tap [10×] for 10× input magnification
- Tap [100×] for 100× input magnification
Waveform Adjustment
Enlarge Waveform:
- Horizontal: Tap the right half of waveform display area
- Vertical: Tap [CTRL] button, then tap [V+] to zoom in
Reduce Waveform:
- Horizontal: Tap the left half of waveform display area
- Vertical: Tap [CTRL] button, then tap [V-] to zoom out
Move Waveform:
- Tap the waveform curve or waveform area, then drag to move in any direction
Adjust Trigger Voltage:
- Tap the green arrow area on the right side of display
- Drag up or down to adjust trigger voltage level
Trigger Settings
Set Trigger Edge:
- Tap the green T control bar area in upper-left corner
- Trigger parameter control bar appears
- In the [Trig Mode] row:
- Tap [Rising] for rising edge trigger
- Tap [Falling] for falling edge trigger
Set Automatic Trigger:
- Tap the green T control bar area
- In the [Trig Mode] row:
- Tap [Auto] for automatic trigger
Set Single Trigger:
- Tap the green T control bar area
- In the [Trig Mode] row:
- Tap [Single] for single-shot trigger
Set Normal Trigger:
- Tap the green T control bar area
- In the [Trig Mode] row:
- Tap [Normal] for normal trigger
Display Control
Pause/Resume Display:
- Tap [RUN/STOP] button in rightmost button bar
- If button not visible, press [CTRL] to switch button bars
Automatic Waveform Adjustment:
- Tap [AUTOSET] button in rightmost button bar
- System automatically optimizes display parameters based on signal
- If button not visible, press [CTRL] to switch button bars
Slow Scan Scrolling Mode:
- Tap the left half of waveform display area repeatedly
- Time base increases with each tap
- When time base reaches 100 ms, system enters slow scan scroll mode
- Range: 100 ms to 50 seconds
Cursor Measurements
Time Cursor Measurement:
- Tap [TIME CURSOR] button in rightmost button bar
- Manually measure time differences and equivalent frequency
- If button not visible, press [CTRL] to switch button bars
Voltage Cursor Measurement:
- Tap [V CURSOR] button in rightmost button bar
- Manually measure voltage levels
- If button not visible, press [CTRL] to switch button bars
Set Display Parameters:
- Tap [MEASURS] button in rightmost button bar
- Parameter control bar opens
- Tap desired parameters in selection bar to display them
- If button not visible, press [CTRL] to switch button bars
Data Capture and Storage
Save Current Screen Display:
- Tap [SAVE PIC] button in rightmost button bar
- Screenshot captured and automatically saved to internal storage
- If button not visible, press [CTRL] to switch button bars
Save Current Waveform Data:
- Tap [SAVE WAVE] button in rightmost button bar
- All open channel waveform data saved to internal storage
- If button not visible, press [CTRL] to switch button bars
View Saved Screenshots:
- Tap [MENU] button in upper-left corner
- 4 function control bars appear
- Tap second option [Picture View]
- Thumbnail preview interface opens showing all screenshots
- Tap thumbnail to view full-screen
- Tap bottom of screen to show control bar with:
- Return – Exit viewer
- Delete – Remove image
- Previous – Previous image
- Next – Next image
- Can also tap [Select All] or [Select] in preview to delete multiple
View Saved Waveform Data:
- Tap [MENU] button in upper-left corner
- Tap third option [Waveform View]
- Thumbnail preview interface opens with saved waveforms
- Tap thumbnail to analyze waveform in full-screen
- Can move and zoom waveforms
- Can use cursor measurement
- Can click parameter control panel to select different parameters
- [Page Up] – Previous waveform
- [Page Down] – Next waveform
Delete Saved Waveform:
- In full-screen waveform view, tap [Delete Wave] button in rightmost button bar
- If button not visible, press [CTRL] to switch button bars
Take Screenshot in Waveform Browser:
- In full-screen waveform view, tap [SAVE PIC] button
- Screenshot captured and saved automatically
- If button not visible, press [CTRL] to switch button bars
Connect to Computer:
- Tap [MENU] button in upper-left corner
- Tap fourth option [USB Connection]
- USB transmission interface opens
- Connect standard Android USB data cable to computer
- Computer will show removable disk
- Find saved screenshots in the disk
- Important: Do not rename files directly on disk, or oscilloscope picture manager cannot display them
System Settings
Adjust Screen Brightness:
- Tap [MENU] button in upper-left corner
- 4 function control bars appear
- Tap first option [System Settings]
- 5 setting control bars appear
- Tap [Screen Brightness]
- Adjust brightness (0 = darkest, 100 = brightest)
Adjust Background Grid Brightness:
- Tap [MENU] button in upper-left corner
- Tap [System Settings]
- Tap [Grid Brightness]
- Adjust grid brightness (0 = grid off, 100 = brightest)
Set Always Trigger Automatically at 50%:
- Tap [MENU] button in upper-left corner
- Tap [System Settings]
- Tap [Always Trigger 50%]
- When turned on (green), system automatically sets trigger voltage to 50% of peak voltage in auto trigger mode
Baseline Calibration: Perform when baseline arrow and horizontal baseline don’t align:
- Unplug all probes
- Unplug USB charging power
- Tap [MENU] button
- Tap [System Settings]
- Tap [Baseline Calibration]
- Tap [OK] to perform calibration
Troubleshooting Guide
Q1: Device won’t turn on after receiving it?
Solution:
- Battery may be depleted after factory testing
- Connect USB charger for 30 minutes before turning on
- Do not use computer USB – insufficient power (use original 5V/2A charger)
- If still not working after charging, contact customer service
Q2: No waveform displayed, only a stationary line on screen?
Solution:
- Check if paused – tap [RUN/STOP] to resume
- Press [AUTOSET] button once
- If still no waveform:
- Verify signal source is outputting
- Check probe for short circuit or open circuit with multimeter
- Test probe and signal source independently
Q3: Voltage measurement shows 0?
Solution:
- Adjust vertical sensitivity and time base
- Or press [AUTOSET] button
- Display should show at least one clear, complete waveform cycle
- Top and bottom of waveform must be visible (not clipped)
- Voltage reading will be accurate once properly displayed
Q4: Frequency measurement shows 0?
Solution:
- Ensure trigger mode is set to Auto
- Press [AUTOSET] button once
- Display should show at least one clear, complete waveform cycle
- Waveform must be triggered (green arrow fixed, not shaking)
- Frequency reading accurate once waveform properly triggered
Q5: Duty cycle shows 0?
Solution:
- Ensure trigger mode is set to Auto
- Adjust trigger line to intersect waveform
- When waveform properly triggered (fixed position), duty cycle reading will be correct
- At least one complete waveform cycle must be visible
Q6: AC coupling looks the same as DC coupling?
Explanation:
- For symmetrical AC signals (like signal generator output), AC and DC coupling appear identical
- For asymmetrical AC or DC pulsating signals, waveform shifts vertically when switching coupling modes
Q7: Waveform jumps up and down continuously, multiple overlapping lines?
Solution:
- Set trigger mode to Auto
- Press [AUTOSET] button
- If not resolved:
- Probe ground clip may not be connected
- Probe end may have open circuit
- Check probe with multimeter
Q8: Waveform shakes horizontally and won’t stabilize?
Solution:
- Adjust trigger voltage (green arrow on right)
- Press and hold green trigger arrow, move up/down
- Position trigger indicator between top and bottom of waveform
- Or enable “Auto 50%” in settings menu
Q9: Cannot capture sudden pulses or digital logic signals?
Solution:
- Change trigger mode to “Normal” or “Single”
- Adjust trigger voltage, time base, and vertical sensitivity
- Wait for signal, then tap [RUN/STOP] to pause
Q10: Measuring battery shows no waveform?
Explanation:
- Battery voltage is stable DC signal with no curve
- In DC coupling mode, adjust vertical sensitivity to see offset straight line
- In AC coupling mode, DC signals blocked – no waveform appears
Q11: Battery won’t fully charge?
Solution:
- May be using laptop USB or charger below 2A
- Laptop USB output too low to fully charge
- Replace with original 5V/2A charger
Q12: 220V 50Hz measurement causes display to lag?
Explanation:
- To display 50 Hz signals, oscilloscope must use very low sampling rate
- This causes slow display update, appearing as “lag”
- Normal behavior for ALL oscilloscopes measuring 50Hz – not a defect
Q13: Measuring 220V shows peak-to-peak over 600V, not 220V or 310V?
Explanation:
- 220V is the RMS (effective) value, not peak-to-peak
- Household 220V AC is symmetrical:
- Positive peak: +310V
- Negative peak: -310V
- Peak-to-peak (Vpp) = 620V
- Tap [Parameter Display] to open control bar and enable “Effective Value” to see 220V
- Actual household voltage fluctuates 180-260V RMS (507-733V peak-to-peak)
Q14: Measured 220V not perfect sine wave – shows distortion?
Explanation:
- Municipal power grids contain harmonic pollution
- Higher-order harmonics superimpose on sine wave, causing distortion
- This is normal and reflects actual power quality – not oscilloscope problem
Q15: Baseline (0V) and left arrow misaligned with no signal?
Solution:
- Unplug all probes
- Unplug USB charging power
- Tap [MENU] → [System Settings] → [Baseline Calibration]
- Tap [OK] to calibrate
Q16: Signals above 5MHz show significant attenuation?
Solution:
- When measuring 5 MHz or higher:
- Move probe switch to 10×
- Set oscilloscope to 10× input mode
- Why: Probe cable has 100-300 pF capacitance
- At 1× setting, effective bandwidth only 5 MHz
- 10× setting provides impedance matching, enables full 100 MHz bandwidth
- Only use probes rated 100 MHz or higher
Q17: Green charging indicator stays on when device is powered on?
Explanation:
- Green indicator means charger supplying power
- When device powered on, charger continues supplying power to system
- Check battery icon in upper-right corner
- When battery icon fully green, battery is fully charged
Common Test Scenarios
1. Battery or DC Voltage Measurement
Probe Setting:
- Battery voltage typically below 40V: Use 1×
- DC voltage above 40V: Use 10× (both probe and oscilloscope)
Procedure:
- Set oscilloscope to Auto trigger mode (default at power-on)
- Set probe multiplier to 1× (or appropriate setting)
- Set coupling mode to DC
- Insert probe and move switch to corresponding position
- Ensure battery/DC source is powered
- Connect probe clip to negative terminal, probe tip to positive
- Press [AUTOSET] once
- Read “Average” parameter for DC voltage value
Note: DC signals appear as horizontal line with offset, not curve. Peak-to-peak and frequency read 0.
2. Crystal Oscillator Measurement
Probe Setting: 10× (both probe and oscilloscope)
Reason: Crystals stop oscillating when encountering capacitance. 1× probe has 100-300 pF, 10× has only 10-30 pF.
Procedure:
- Set oscilloscope to Auto trigger mode
- Set probe multiplier to 10×
- Set coupling mode to AC
- Move probe switch to 10×
- Ensure crystal board powered and running
- Connect probe clip to ground (power negative)
- Remove probe cap to expose needle tip
- Touch needle to crystal oscillator pin
- Press [AUTOSET] to display waveform
- Press [CTRL], then use [V+] and [V-] to adjust if needed
3. PWM Signal (MOS/IGBT Drive) Measurement
Probe Setting: 1× (both probe and oscilloscope)
Reason: PWM signals typically 3-20V, within 40V maximum of 1× range
Procedure:
- Set oscilloscope to Auto trigger mode
- Set probe multiplier to 1×
- Set coupling mode to DC
- Move probe switch to 1×
- Ensure PWM board outputting signal
- Connect probe clip to MOS/IGBT Source (S) pin
- Connect probe tip to Gate (G) pin
- Press [AUTOSET] to display PWM waveform
- Press [CTRL], use [V+] and [V-] to adjust if needed
4. Signal Generator Output Measurement
Probe Setting: 1× (both probe and oscilloscope)
Reason: Signal generator output typically within 30V
Procedure:
- Set oscilloscope to Auto trigger mode
- Set probe multiplier to 1×
- Set coupling mode to DC
- Move probe switch to 1×
- Ensure signal generator on and outputting
- Connect probe clip to generator black (ground) lead
- Connect probe tip to generator red (signal) lead
- Press [AUTOSET] to display waveform
5. Household AC Power (220V/110V) Measurement
Probe Setting: 100× (requires separate 100× probe – not included)
Reason:
- Household power: 180-260V RMS = 507-733V peak-to-peak
- 1× maximum: 40V
- 10× maximum: 400V
- 100× maximum: 4000V
Procedure:
- Purchase 100× probe separately
- Set oscilloscope to Auto trigger mode
- Set probe multiplier to 100×
- Set coupling mode to AC
- Move probe switch to 100×
- Ensure AC power outlet active
- Connect probe clip and tip to both AC wires (polarity doesn’t matter)
- Press [AUTOSET] to display waveform
⚠️ WARNING: Standard 10× probe CANNOT safely measure household AC!
6. Power Supply Ripple Measurement
Probe Setting:
- Output below 40V: 1×
- Output 40-400V: 10×
Procedure:
- Set oscilloscope to Auto trigger mode
- Set probe multiplier to appropriate gear
- Set coupling mode to AC (critical for ripple)
- Move probe switch to corresponding position
- Ensure power supply on and outputting
- Connect probe clip to negative output
- Connect probe tip to positive output
- Wait ~3 seconds until yellow line aligns with left arrow
- Press [AUTOSET] to display ripple
Note: AC coupling essential – blocks DC, shows only ripple.
7. Inverter Output Measurement
Probe Setting: 100× (requires separate purchase)
Reason: Inverter output similar to household AC, peak-to-peak above 500V
Procedure:
- Set oscilloscope to Auto trigger mode
- Set probe multiplier to 100×
- Set coupling mode to DC
- Move probe switch to 100×
- Ensure inverter powered and outputting
- Connect probe clip and tip to inverter output (polarity doesn’t matter)
- Press [AUTOSET] to display waveform
8. Audio/Power Amplifier Signal Measurement
Probe Setting: 1× (both probe and oscilloscope)
Reason: Amplifier output typically below 40V
Procedure:
- Set oscilloscope to Auto trigger mode
- Set probe multiplier to 1×
- Set coupling mode to AC
- Move probe switch to 1×
- Ensure amplifier on and outputting audio
- Connect probe clip and tip to amplifier output (polarity doesn’t matter)
- Press [AUTOSET] to display waveform
9. Vehicle Communication/Bus Signal Measurement
Probe Setting: 1× (both probe and oscilloscope)
Reason: Automotive communication signals typically below 20V
Procedure:
- Set oscilloscope to Normal trigger mode (NOT Auto)
Reason: Communication signals are non-periodic digital - Set probe multiplier to 1×
- Set coupling mode to AC
- Move probe switch to 1×
- Connect probe clip and tip to two communication signal lines (polarity doesn’t matter)
- Ensure communication actively occurring
- Adjust vertical sensitivity to 50 mV
- Adjust time base to 20 μs
- Press [50% TRIG] once
- Oscilloscope captures and displays signal when communication occurs
- If no capture, try adjusting time base (1 ms to 100 ns) and trigger voltage
10. Infrared Remote Control Receiver Measurement
Probe Setting: 1× (both probe and oscilloscope)
Reason: IR signals typically 3-5V
Procedure:
- Set oscilloscope to Normal trigger mode
Reason: IR signals are non-periodic digital coded - Set probe multiplier to 1×
- Set coupling mode to DC
- Move probe switch to 1×
- Connect probe clip to IR receiver ground (negative)
- Connect probe tip to IR receiver data pin
- Adjust vertical sensitivity to 500 mV
- Adjust time base to 20 μs
- Adjust trigger red arrow to approximately 1 grid distance from left yellow arrow
- Press button on IR remote control
- Waveform appears on oscilloscope
11. Sensor Amplifier Circuit Measurement
(Temperature, Humidity, Pressure, Hall Effect, etc.)
Probe Setting: 1× (both probe and oscilloscope)
Important: Sensor raw signals very weak (millivolts) – cannot measure directly. Must locate amplifier output on sensor board.
Procedure:
- Set oscilloscope to Auto trigger mode
- Set probe multiplier to 1×
- Set coupling mode to DC
- Move probe switch to 1×
- Connect probe clip to sensor board ground (power negative)
- Locate amplifier output pin, connect probe tip
- Adjust vertical sensitivity to 50 mV
- Adjust time base to 500 ms (enters slow scan mode)
- Move baseline to bottom of screen
- If signal appears at top, reduce vertical sensitivity (try 100 mV, 200 mV, 500 mV)
- Optimal: signal traces in middle of screen (not clipped)
- Observe slow changes as sensor responds
Specifications Summary
| Feature | Specification |
|---|---|
| Channels | 2 (independent) |
| Bandwidth | 100 MHz per channel |
| Sampling Rate | 1 GSa/s |
| Input Voltage Range | 0-40V (1× mode) |
| Maximum Input | 400V continuous (with protection) |
| Display | 7″ capacitive touchscreen, 800 × 480 |
| Operation | Touch + gesture control |
| Time Base Range | 2 ns/div to 50 s/div |
| Trigger Modes | Auto, Normal, Single |
| Trigger Types | Edge (Rising/Falling) |
| Coupling | AC, DC |
| Storage | 1 GB (1000 screenshots + 1000 waveforms) |
| Battery | 6000mAh rechargeable lithium |
| Battery Life | 4 hours continuous operation |
| Charging | Use while charging capability |
| Interface | USB (file sharing) |
| Power | Rechargeable battery + USB charging |
Maintenance and Care
- Charge with original 5V/2A charger – Do not use laptop USB or low-current chargers
- Never exceed 400V input voltage
- Store in cool, dry environment
- Clean touchscreen with soft, lint-free cloth – No solvents or abrasives
- Protect probes from physical damage
- Perform baseline calibration periodically
- Fully discharge/recharge battery monthly to maintain capacity
- Safely eject USB drive before disconnecting from computer
Warranty and Support
For technical support, warranty information, or product inquiries, please contact FNIRSI customer service.
Document Version: Enhanced Visual Edition with Touchscreen Controls
Original Manual: FNIRSI-1013D User Guide